
Azure Monitor: End‑to‑End Observability in Azure
Anyone working with the cloud knows that monitoring is not a luxury – it’s a core pillar of every modern architecture. Azure Monitor is Microsoft’s unified observability platform for infra to code, collecting metrics, logs, and traces across Azure, on-prem via Azure Arc, and even other clouds.
You can visualize with Workbooks and dashboards, query using Kusto Query Language (KQL), and act in real time with Alerts and Action Groups that trigger notifications or automation when thresholds are crossed.
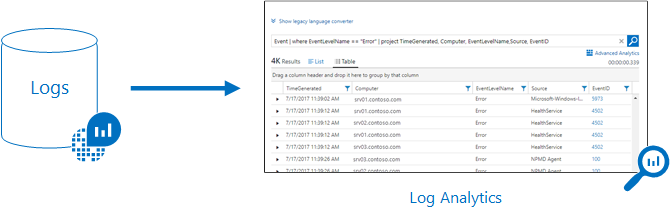
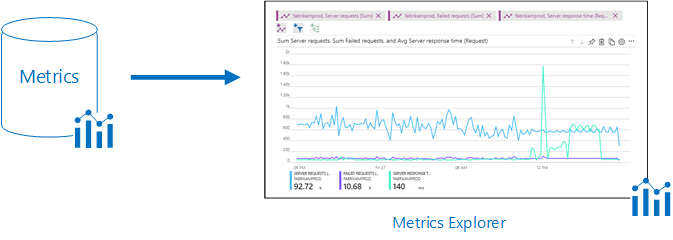
Azure Monitor’s two data pillars: Metrics for near real-time numeric time-series, and Logs for rich, schema-flexible events explored with KQL.
It integrates with Application Insights and Container Insights, giving you a connected view from infrastructure health to application performance – all in one place.
Table of Contents
- Architecture
- Metrics vs Logs
- Application Insights & Tracing
- AKS, Prometheus & OpenTelemetry
- Alerts & Action Groups
- Useful KQL Queries
- Cost, Retention & Data Collection
- Enterprise Governance
- Official docs
1 · Architecture
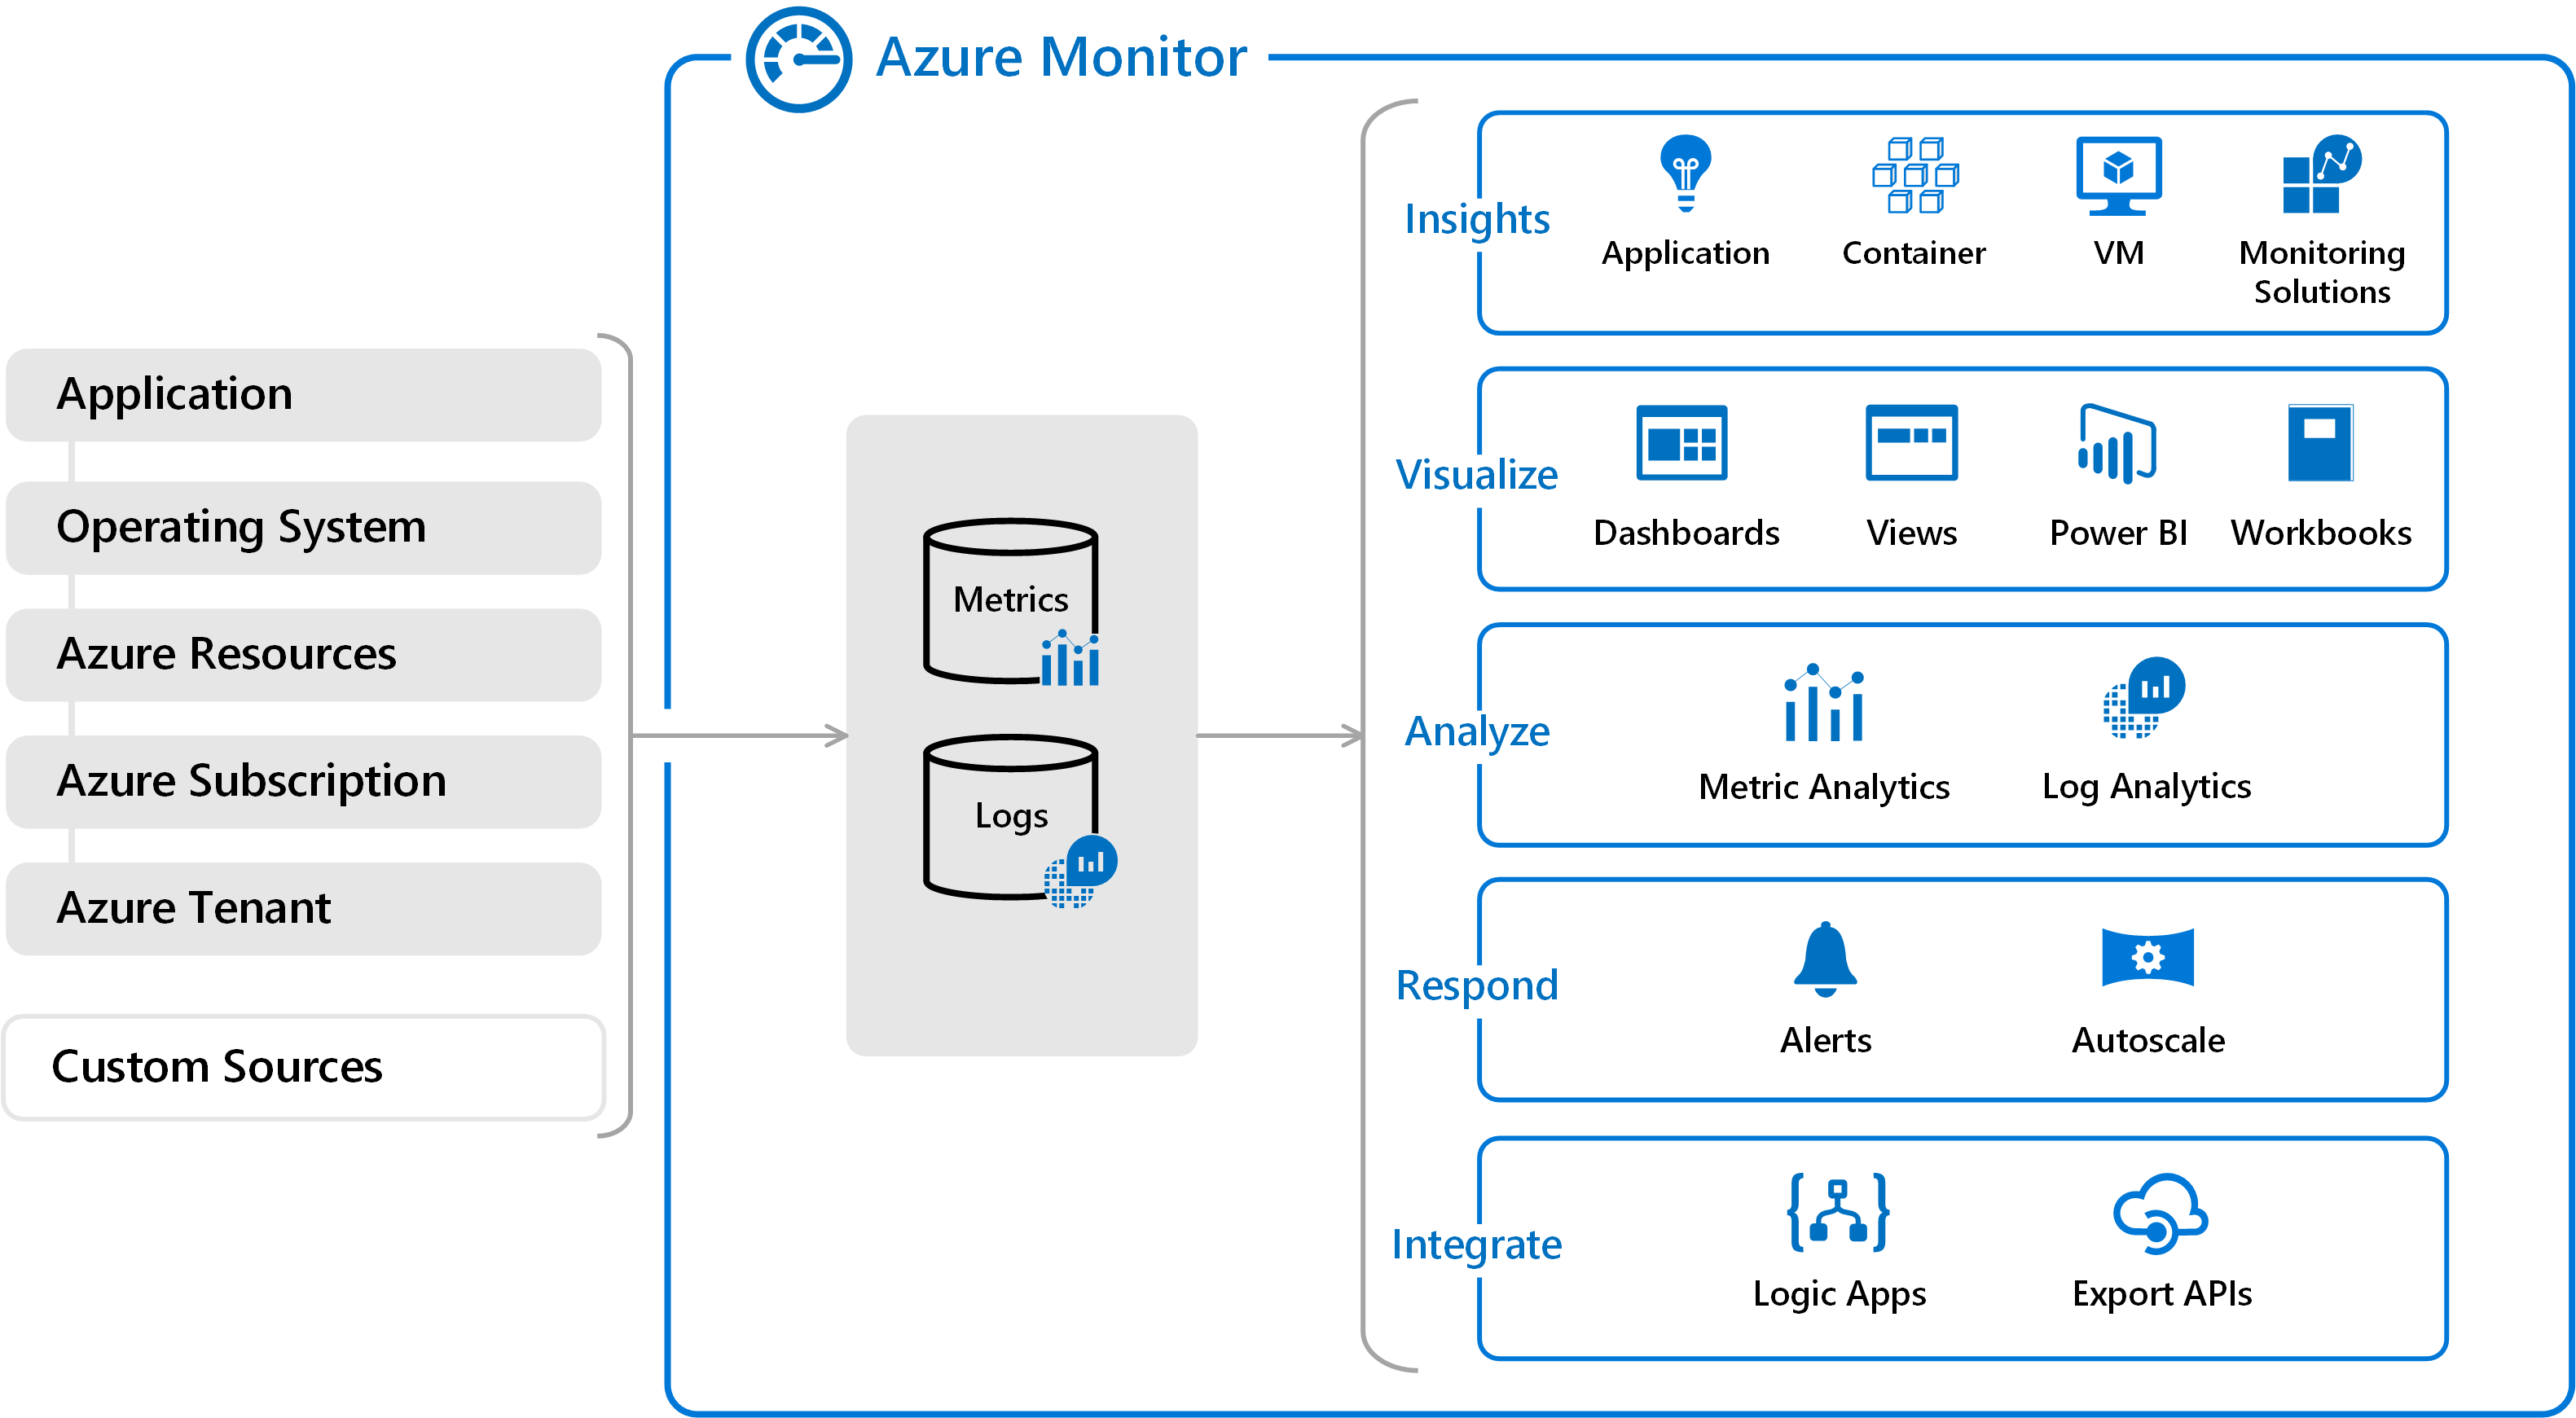
Azure Monitor follows a clear end-to-end pipeline: Collect → Store → Analyze → Act. Each stage is modular, so you can connect the data sources you need, retain it in the right storage layer, explore it visually or programmatically, and then trigger automated actions based on your findings.
-
Collect – Data can come from many sources:
- Diagnostic Settings on Azure resources to stream metrics and logs into Azure Monitor.
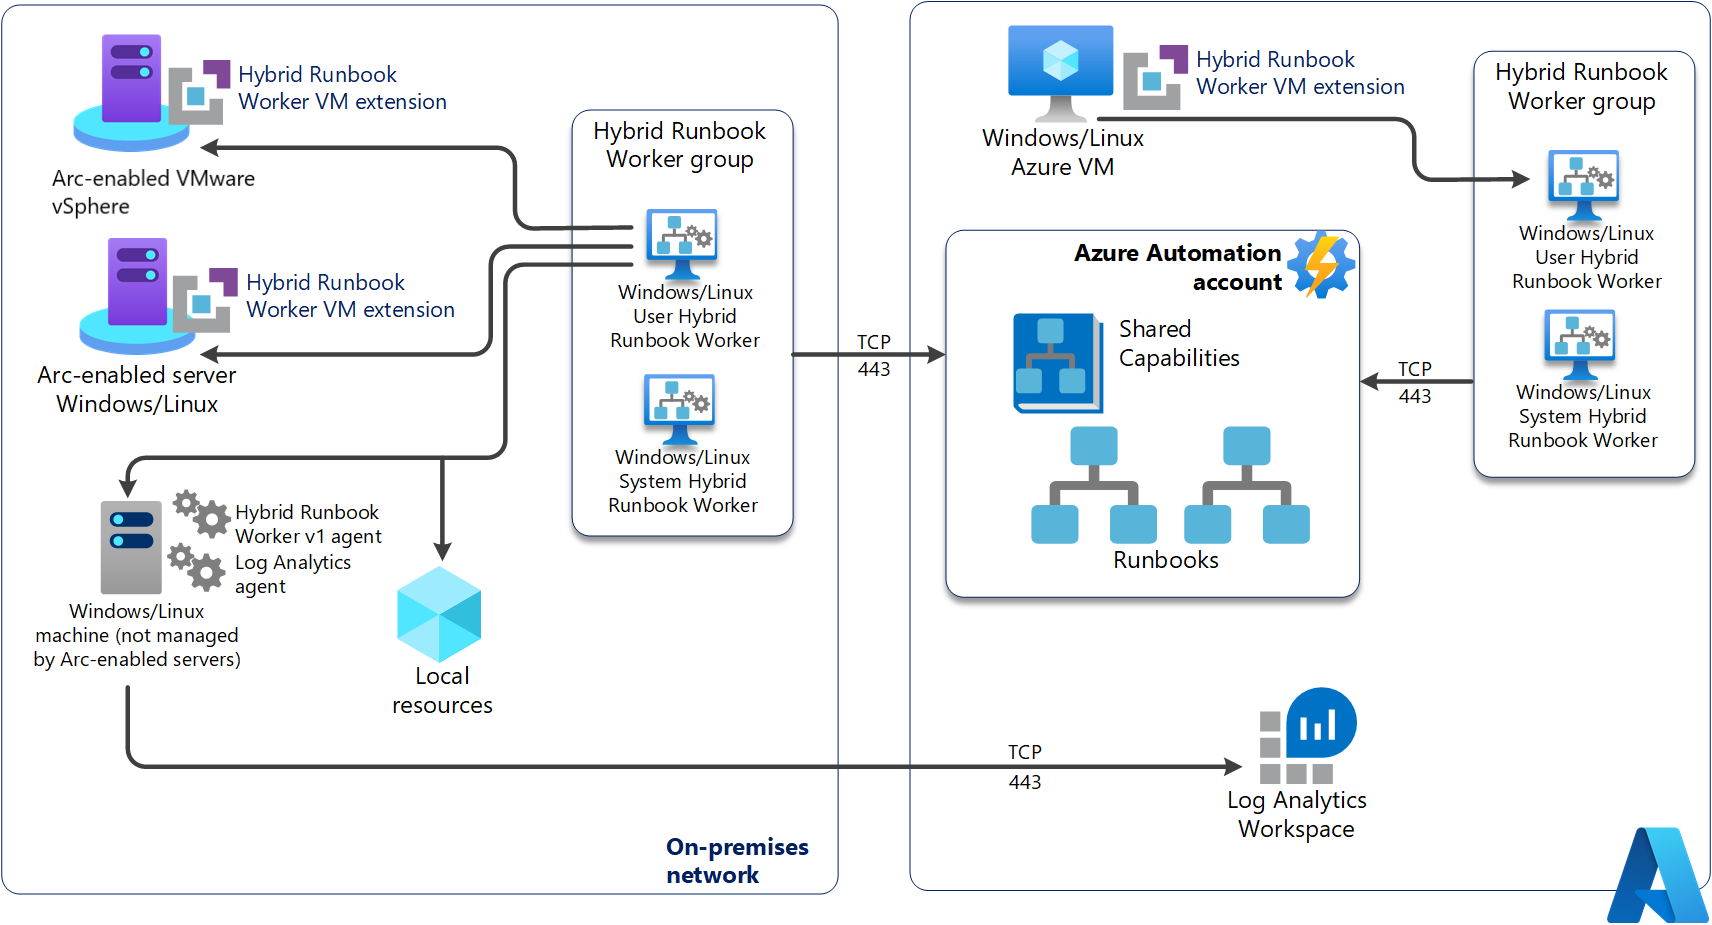
- Azure Monitor Agent (AMA) managed through Data Collection Rules (DCR) to ingest telemetry from VMs, scale sets, and Arc-enabled servers.
- Azure Arc to bring on-premises and multi-cloud servers into the same observability framework.
- Application-level telemetry via SDKs, including OpenTelemetry for industry-standard tracing and metrics collection.
-
Store – Data is persisted in the right back-end for the job:
- Log Analytics Workspace for schema-flexible log data, queryable with KQL.
- A dedicated Metrics time-series store for high-frequency, low-latency numeric data.
-
Analyze – Tools to explore and visualize:
- Workbooks for interactive, multi-data-source visualizations.
- Azure dashboards to combine multiple monitoring widgets in one view.
- KQL queries that can span one or multiple workspaces, enabling cross-resource correlation.
-
Act – Turning insights into action:
- Alert rules for metric thresholds, log query results, or even anomaly detection.
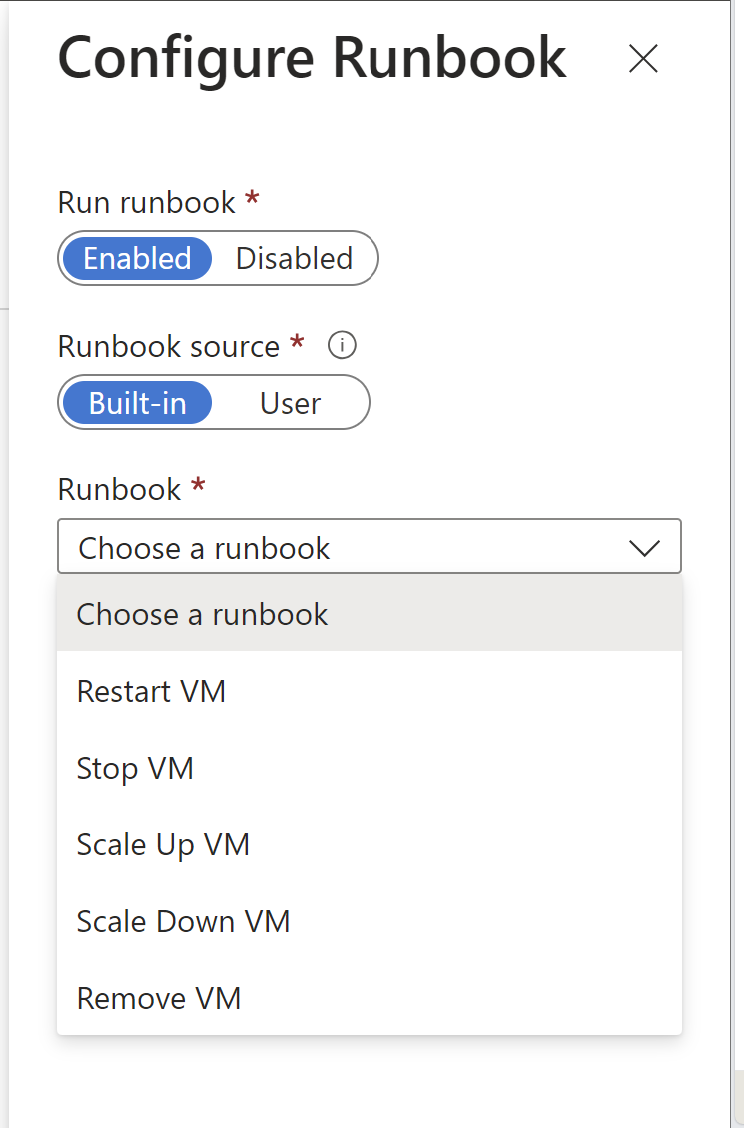
- Action Groups to send notifications (email, SMS, push), trigger webhooks, or run automation like Logic Apps, Functions, or Automation Runbooks.
2 · Metrics vs Logs
Metrics are lightweight numerical time-series that are optimized for speed and scale. They are perfect for visualizing trends in dashboards and for triggering alerts within seconds. Common examples include CPU usage, memory consumption, request rates, and response times. Logs, on the other hand, are detailed, schema-flexible records that capture rich contextual data — such as requests, exceptions, and audit events — and can be explored using Kusto Query Language (KQL) for deep analysis and historical insights.
Real-world example: when ticket sales open for a major concert in Yarkon Park, request rate and CPU metrics will spike. Autoscale rules can react instantly to add capacity and maintain performance. Meanwhile, request and dependency logs provide the granular view you need to pinpoint slow endpoints, failed API calls, or database bottlenecks — so you can optimize the hot paths without risking production stability.
3 · Application Insights & Tracing
Application Insights is Azure Monitor’s Application Performance Monitoring (APM) capability. It tracks key telemetry such as requests, dependencies, exceptions, availability, and user flows. With distributed tracing, you can follow a single transaction end-to-end across multiple services and correlate it with infrastructure metrics for complete context.
- Enable via the SDK or an OpenTelemetry exporter for .NET, Node.js, Python, Java, and more.
- Use Live Metrics for near real-time performance insights, and Availability Tests to simulate user access from global locations.
- Pin charts to Azure dashboards and share Workbooks with development, operations, and product teams for a shared view of health and usage.
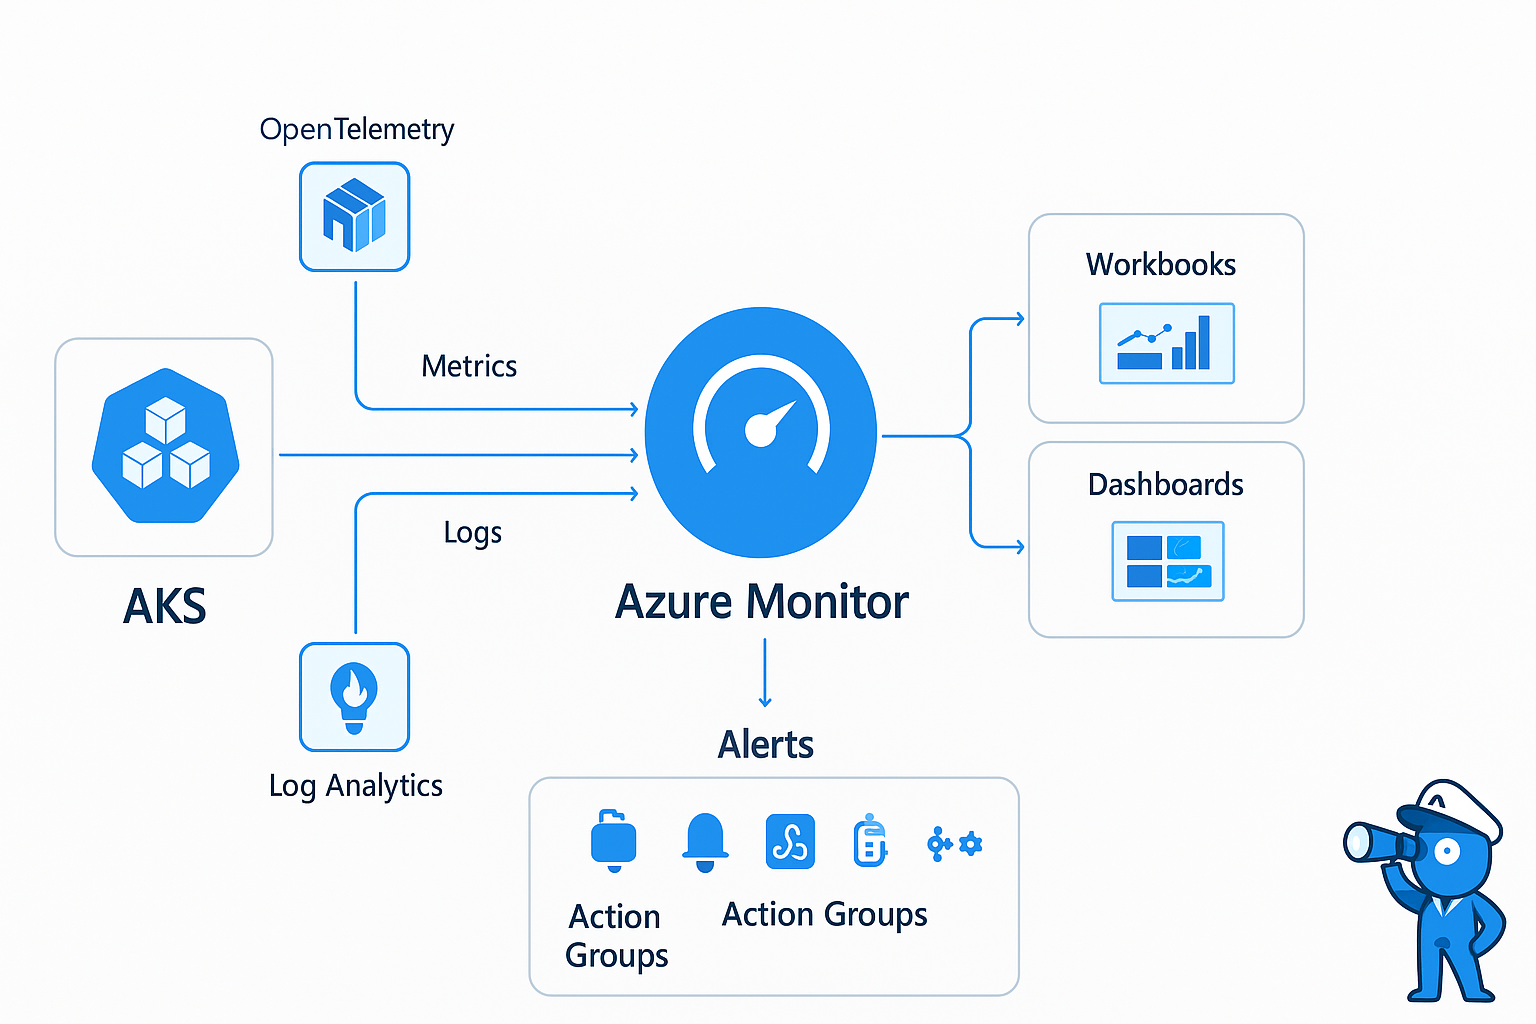
4 · AKS, Prometheus & OpenTelemetry
When running workloads on Azure Kubernetes Service (AKS), visibility is critical. Container Insights integrates natively with Azure Monitor to provide real-time health and performance data for nodes, pods, and controllers. This includes CPU, memory, network usage, and container restarts, all viewable in Azure Workbooks or Grafana.
For more advanced, cloud-native observability, Azure offers a managed Prometheus service. It automatically scrapes Kubernetes endpoints for metrics and stores them in a highly-available backend, without requiring you to manage your own Prometheus server. This makes it easier to integrate with Azure Managed Grafana for rich dashboards.
Logs from AKS are ingested into a Log Analytics Workspace via the Azure Monitor Agent, where they can be queried with KQL for troubleshooting and performance tuning.
To standardize observability across polyglot microservices, OpenTelemetry exporters can be deployed in your services. This unifies metrics, logs, and distributed traces — regardless of the language or framework — enabling full end-to-end correlation from front-end requests down to container-level telemetry.
5 · Alerts & Action Groups
In Azure Monitor, alerts continuously evaluate telemetry against defined conditions. When a condition is met, it triggers an Action Group — a reusable set of notification and remediation steps. Action Groups can send emails, push notifications, Teams messages, open ITSM tickets, call webhooks, or run automated workflows via Azure Logic Apps, Functions, or Automation Runbooks.
- Create a Log Alert by writing a KQL query that captures the desired signal and define its evaluation frequency.
- Set thresholds — for example, trigger if more than 5 critical exceptions occur within 5 minutes.
- Attach an Action Group to notify the on-call team and optionally run automated remediation scripts.
// Example KQL for a log alert - top exceptions in the last 5 minutes
exceptions
| where severityLevel >= 3
| where timestamp > ago(5m)
| summarize count() by type
| order by count_ desc
By combining alerts with automation, you can move from reactive firefighting to proactive, self-healing infrastructure. For example, a high CPU alert on a Kubernetes node could automatically trigger a scale-out action or pod rescheduling without human intervention.
6 · Useful KQL Queries
One of the biggest advantages of Azure Monitor is the ability to run Kusto Query Language (KQL) queries directly against your telemetry. With KQL you can turn raw signals into actionable insights in seconds. Here are some practical examples:
// High CPU VMs in last 1 hour - find hotspots quickly
InsightsMetrics
| where Name == "Percentage CPU" and TimeGenerated > ago(1h)
| summarize avg(Val) by bin(TimeGenerated, 5m), Computer
| where avg_Val > 80
| order by avg_Val desc

// 4xx and 5xx errors by app - identify failing services
requests
| where timestamp > ago(1d)
| summarize count() by tostring(resultCode), cloud_RoleName
| where resultCode startswith "4" or resultCode startswith "5"
| order by count_ desc

// Slow dependencies over 1s - spot backend bottlenecks
dependencies
| where timestamp > ago(1h)
| where duration > 1s
| summarize avg(duration), percentiles(duration, 50, 95, 99) by target
| top 20 by percentile_duration_99 desc
These queries can be pinned to a Workbook, used in scheduled alert rules, or even embedded into automation workflows so issues are detected and addressed without human intervention.
7 · Cost, Retention & Data Collection
Observability is only effective if it is sustainable. Managing ingestion, storage, and analysis costs is crucial:
- Right-size collection – Only enable diagnostic categories you actually need. Verbose logs can blow up costs fast.
- Use Data Collection Rules (DCR) – Route data to the right workspace, apply filters at the ingestion point, and avoid storing irrelevant records.
- Retention strategy – Keep 30–90 days “hot” in Log Analytics for operational work, then archive to cheaper storage for compliance or long-term analytics.
- Commitment tiers – If you ingest a consistent volume, commitment tiers in Log Analytics can cut costs significantly.
- Prefer Workbooks over exports – Build interactive dashboards and scheduled queries inside Azure Monitor before exporting raw data to external tools.
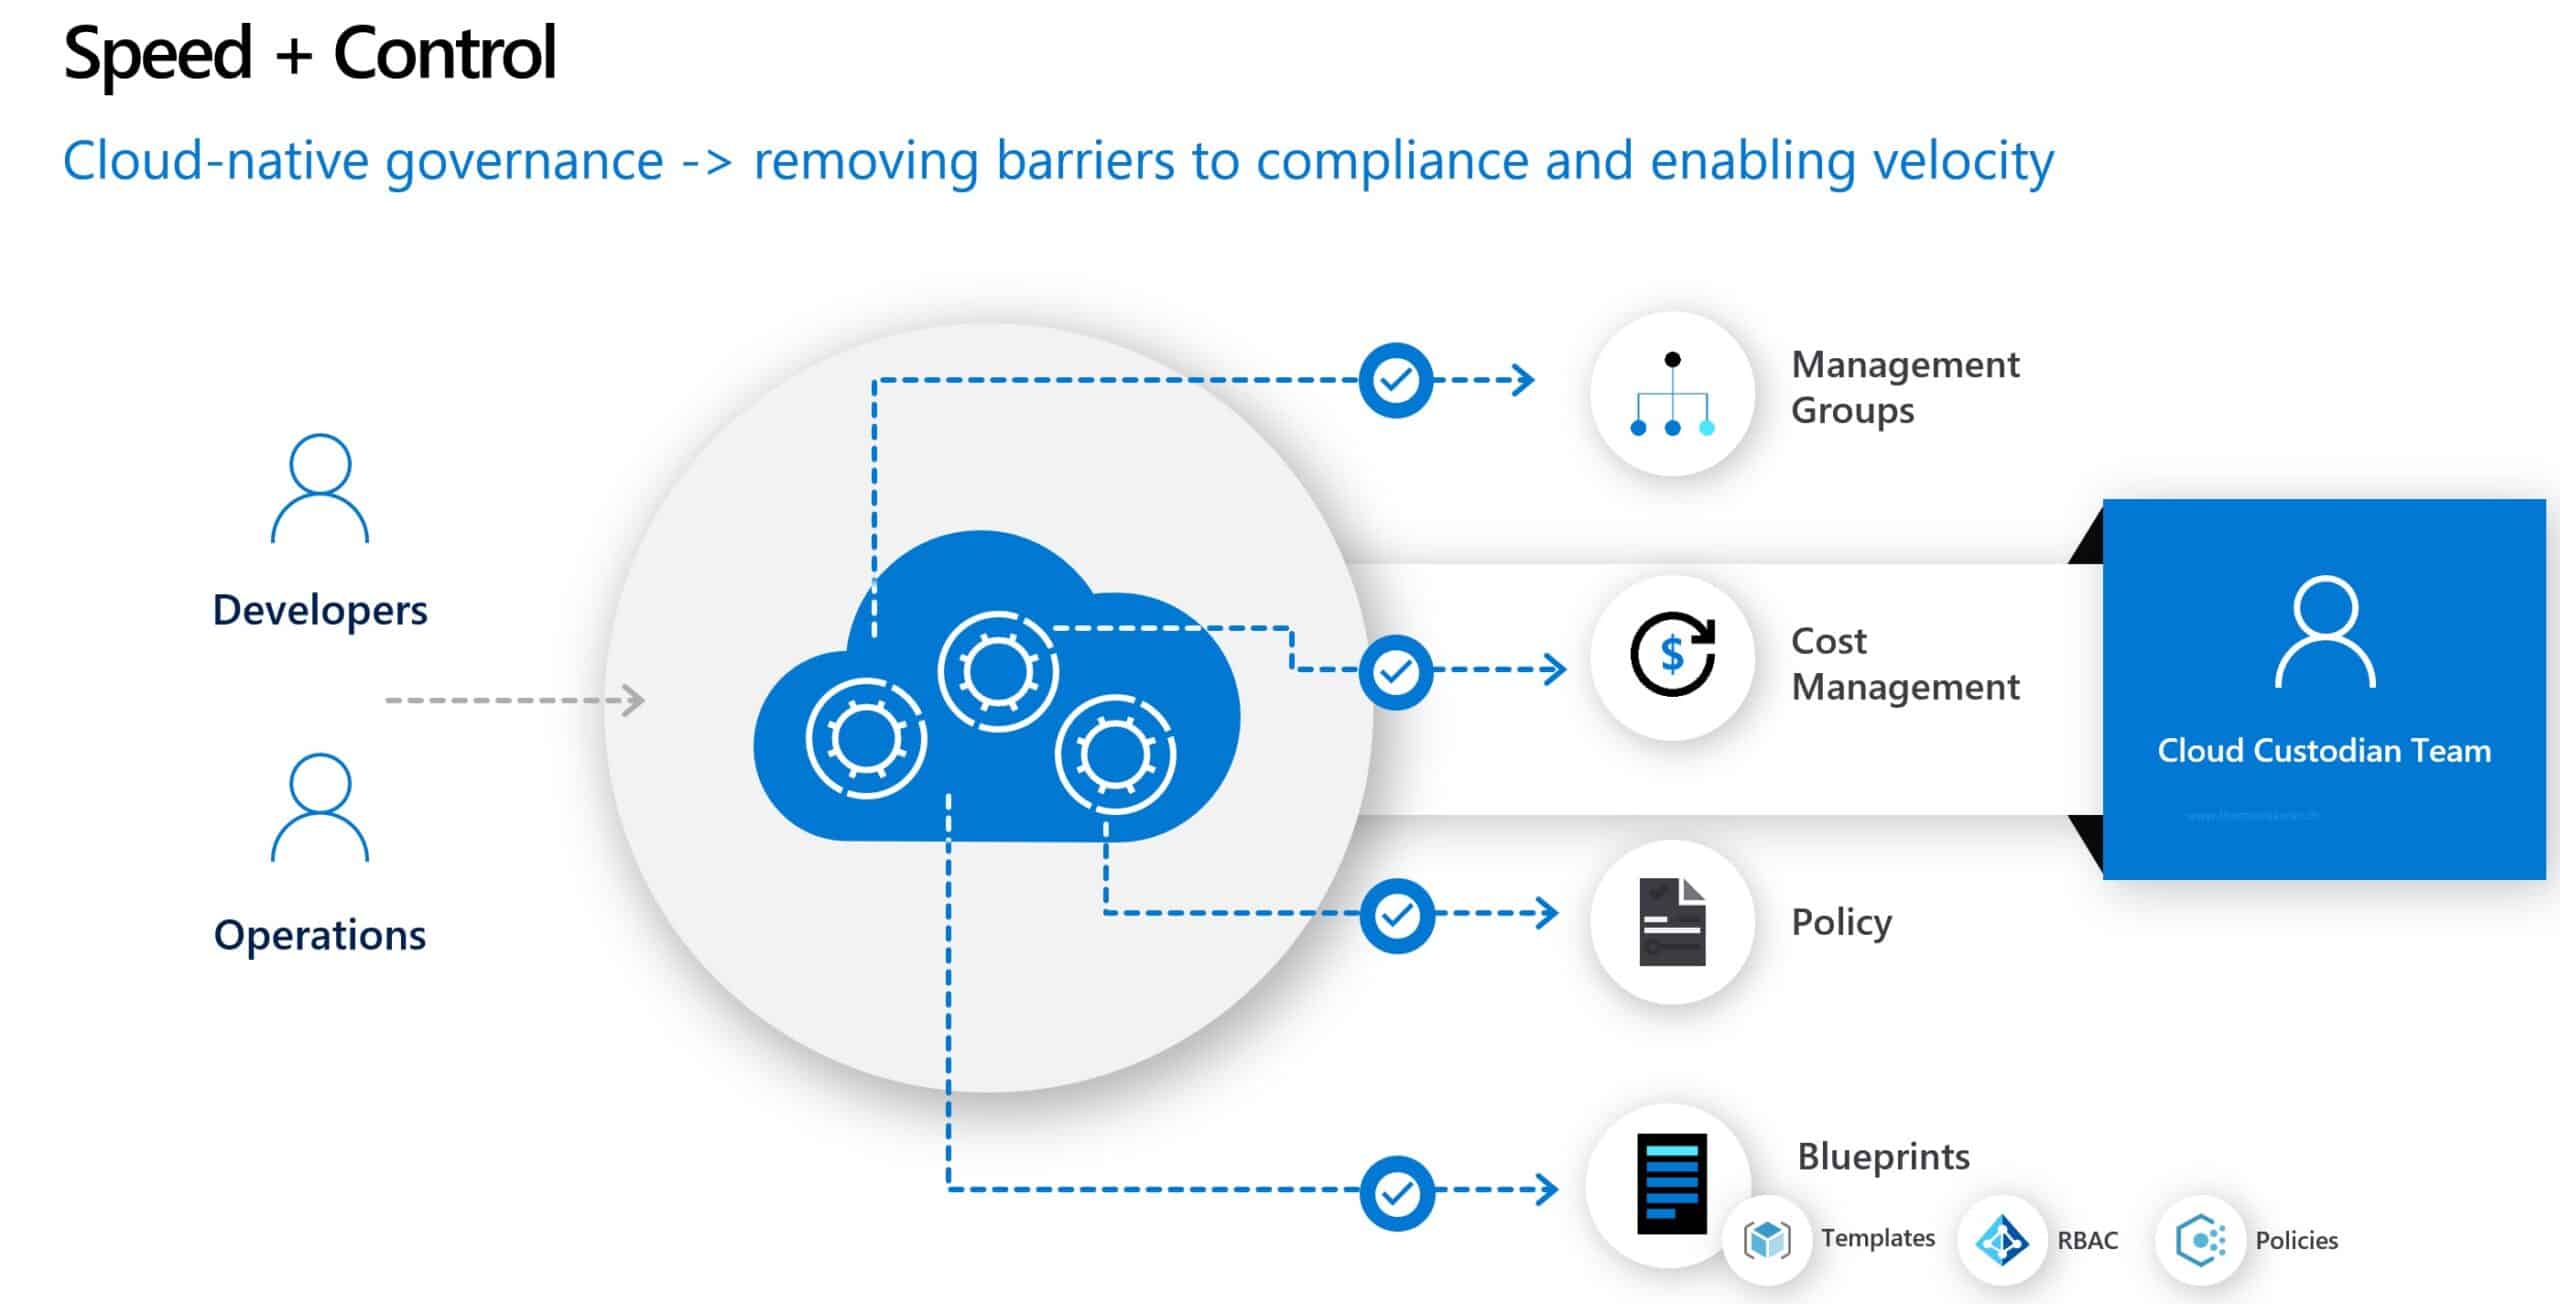
8 · Enterprise Governance
In large environments, governance ensures consistency, security, and compliance across subscriptions:
- Deploy Diagnostic Settings at scale with Azure Policy so every resource streams logs and metrics automatically.
- Standardize Workbooks and Action Groups with Bicep or Terraform modules for repeatable deployments.
- Leverage Management Groups for policy scope and apply Role-Based Access Control (RBAC) for least privilege access to monitoring data.
This structured approach ensures your observability implementation is not only powerful, but also maintainable and compliant over time.
9 · Official docs
- Azure Monitor overview
- Azure Monitor Agent & Data Collection Rules
- Application Insights
- Alerts and Action Groups
- Log Analytics Workspace
- KQL language reference