 Captain Azure
Every dashboard is green. CPU is fine. Latency is fine. Uptime reads 99.99%. And your AI system is confidently telling customers the wrong thing.
This is the uncomfortable reality of running AI in production: traditional monitoring was built to answer "is it up?" - not "is it right?" Those are very different questions, and the gap between them is where most AI failures live. A 200 OK is not the same as correct.
"Production AI is a moving target - once you deploy an agent, its behavior can shift without a single line of code being changed."
This post walks through why classic monitoring misses AI-specific failures, how to correlate signals across infrastructure, data, and model layers, where an AI gateway fits in as a cost and observability control point - and closes with a real, open-source reference implementation you can deploy yourself.
Table of Contents
- Why Traditional Monitoring Breaks
- Three Layers, One Signal: Correlating Infra, Data & Model
- Distributed Tracing & Microsoft Foundry
- Quality Metrics: The Missing Half of Observability
- Observability Starts With Understanding Consumption
- APIM as a Governance & Observability Layer
- Open Source Reference: TeraSky's AI Foundry FinOps Framework
- The Operating Loop
- Takeaways
1 · Why Traditional Monitoring Breaks
Classic observability - latency, error rates, 5xx codes, CPU and memory - assumes deterministic systems. Same input, same output, every time. A failure is loud: an exception, a timeout, a spike on a graph.
AI systems break that assumption entirely. A model can return a 200 OK with a hallucinated answer, a broken retrieval result, or a reasoning chain that quietly went off the rails - and every infrastructure metric will look perfect the whole time.
| Traditional Monitoring | AI Observability |
|---|---|
| Is it up? (latency, 5xx, CPU) | Is it right? |
| Deterministic | Probabilistic |
| Errors are loud | Failures are silent |
| Cost is predictable | Cost sprawls with tokens |
📘 Official Microsoft documentation: Observability in Generative AI - Microsoft Foundry
2 · Three Layers, One Signal: Correlating Infra, Data & Model
AI systems fail across three layers at once - infrastructure, data, and model - and the real skill isn't watching each layer separately, it's correlating a single signal across all three.

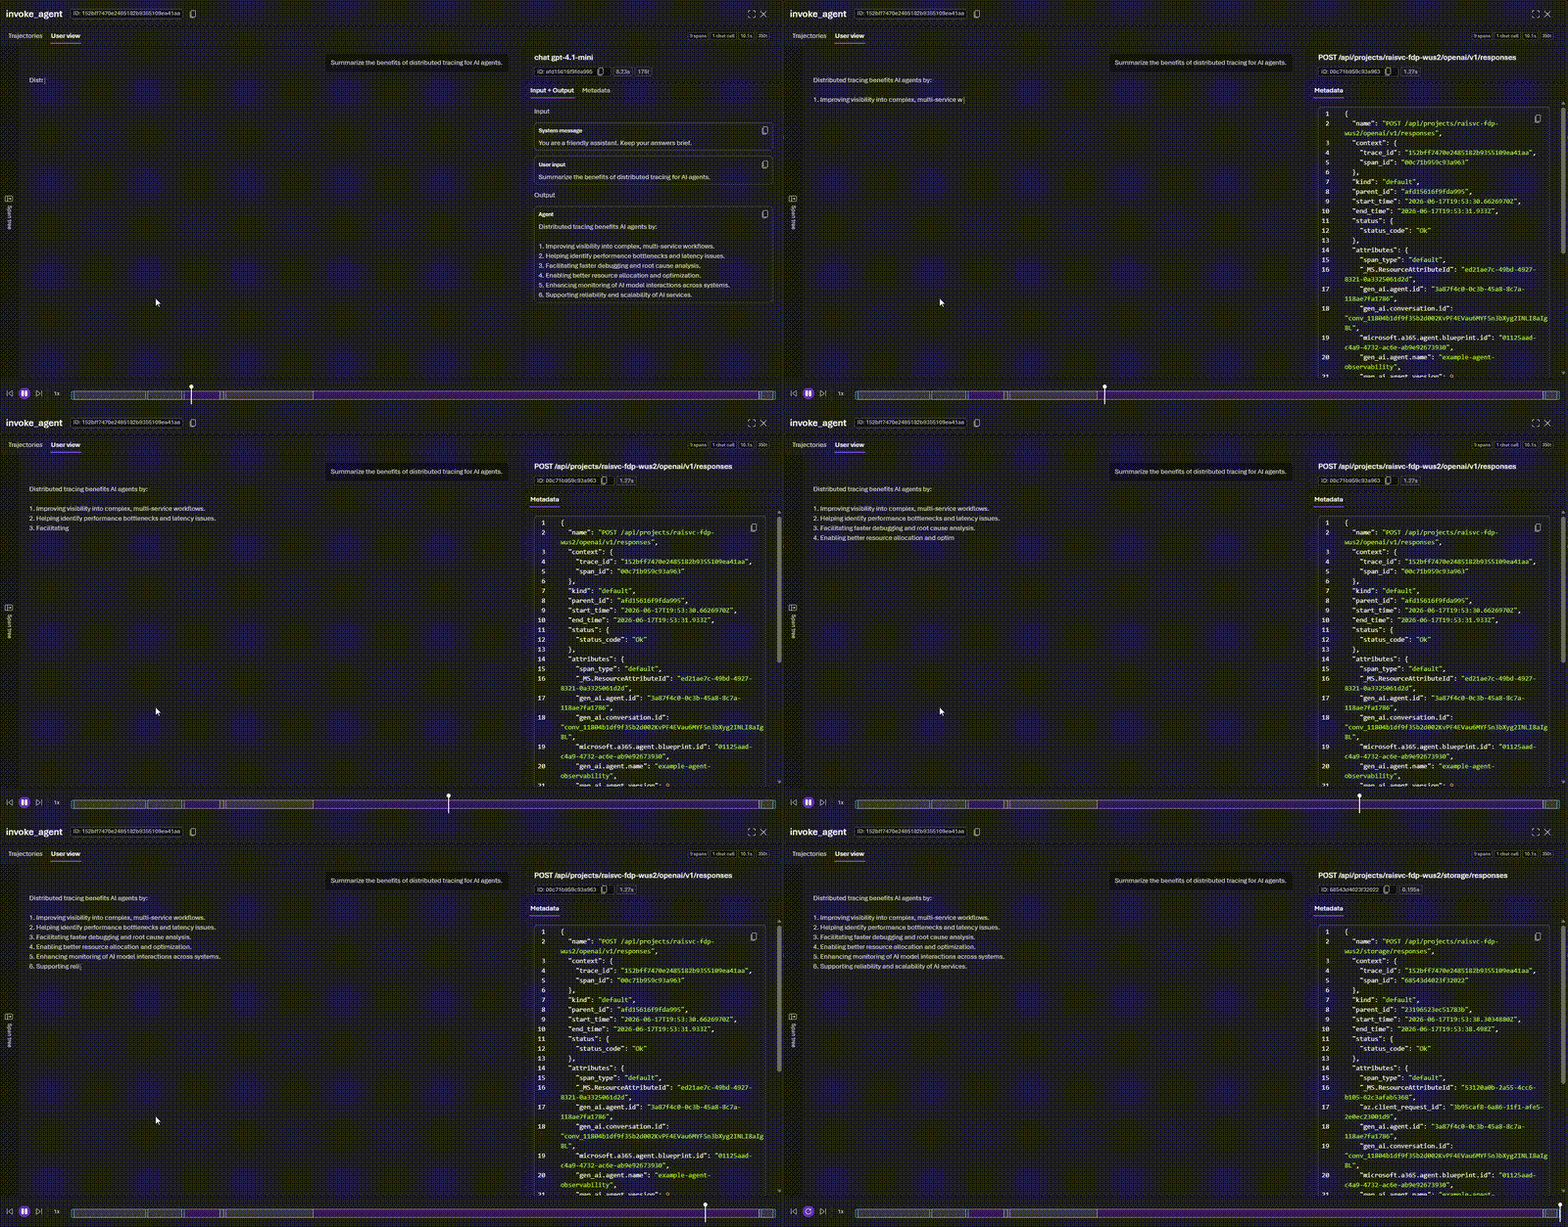
One trace, three layers - correlating signal beats monitoring each layer in isolation.
A realistic chain: a latency spike in infra triggers a timeout, which triggers a retry, which triples token cost - because the retry pulled in a much longer context, sourced from a bad retrieval step in the data layer. Four symptoms, one root cause, four different dashboards if you're not tracing end to end.
3 · Distributed Tracing & Microsoft Foundry
This is where distributed tracing earns its keep. Built on OpenTelemetry, tracing captures the full execution path of an AI request - model calls, tool invocations, retrieval steps, and agent-to-agent handoffs - as a single connected trace rather than isolated logs per component.
Microsoft Foundry: Models, Machine Learning, Agent Service, Tools and IQ, unified under one Control Plane spanning edge and cloud.
Microsoft Foundry is a useful concrete example of what unified telemetry looks like in practice. Evaluation results, traces, latency, token usage, and quality metrics all land in the same Azure Monitor Application Insights workspace - so when a groundedness score drops, you can tell in minutes whether the cause is a model update, a retrieval pipeline issue, or an infrastructure problem, instead of hours of manual correlation across disconnected tools.
Foundry's observability and evaluation capabilities - evaluation, monitoring, and tracing - reached general availability in March 2026, with tracing support across popular agent frameworks including LangChain, LangGraph, the OpenAI Agents SDK, and the Microsoft Agent Framework.
📘 Official Microsoft documentation: Set up tracing in Microsoft Foundry
4 · Quality Metrics: The Missing Half of Observability
Alongside tracing, you need metrics that speak to quality, not just health:
- Groundedness - is the output actually supported by the retrieved context? Critical for RAG.
- Relevance - does the response address what was actually asked?
- Coherence and fluency - does the output hold together logically and linguistically?
- Task completion / tool-call accuracy - for agentic systems, did the agent actually do the thing?
These are typically scored on a continuous scale, not pass/fail, because AI quality genuinely lives on a spectrum. Production behavior also drifts even without a code change - model updates, shifting user input, data drift - so one-time pre-deployment evaluation isn't enough. The emerging best practice is continuous evaluation in production, sampling a percentage of live traffic (commonly starting around 5-10%) and tuning that rate against cost, since every sampled evaluation is itself an additional model call.
5 · Observability Starts With Understanding Consumption
Before you can observe quality, you need to observe usage - and AI consumption is measured very differently from a typical web workload. The core unit is the token (input tokens + output tokens), and everything else - cost, throughput, and quota behavior - derives from it.
- TPM (Tokens Per Minute) - measures throughput and rate limits.
- RPM (Requests Per Minute) - the number of API calls allowed per minute.
- PTU (Provisioned Throughput Units) - reserved capacity for predictable, high-volume workloads.
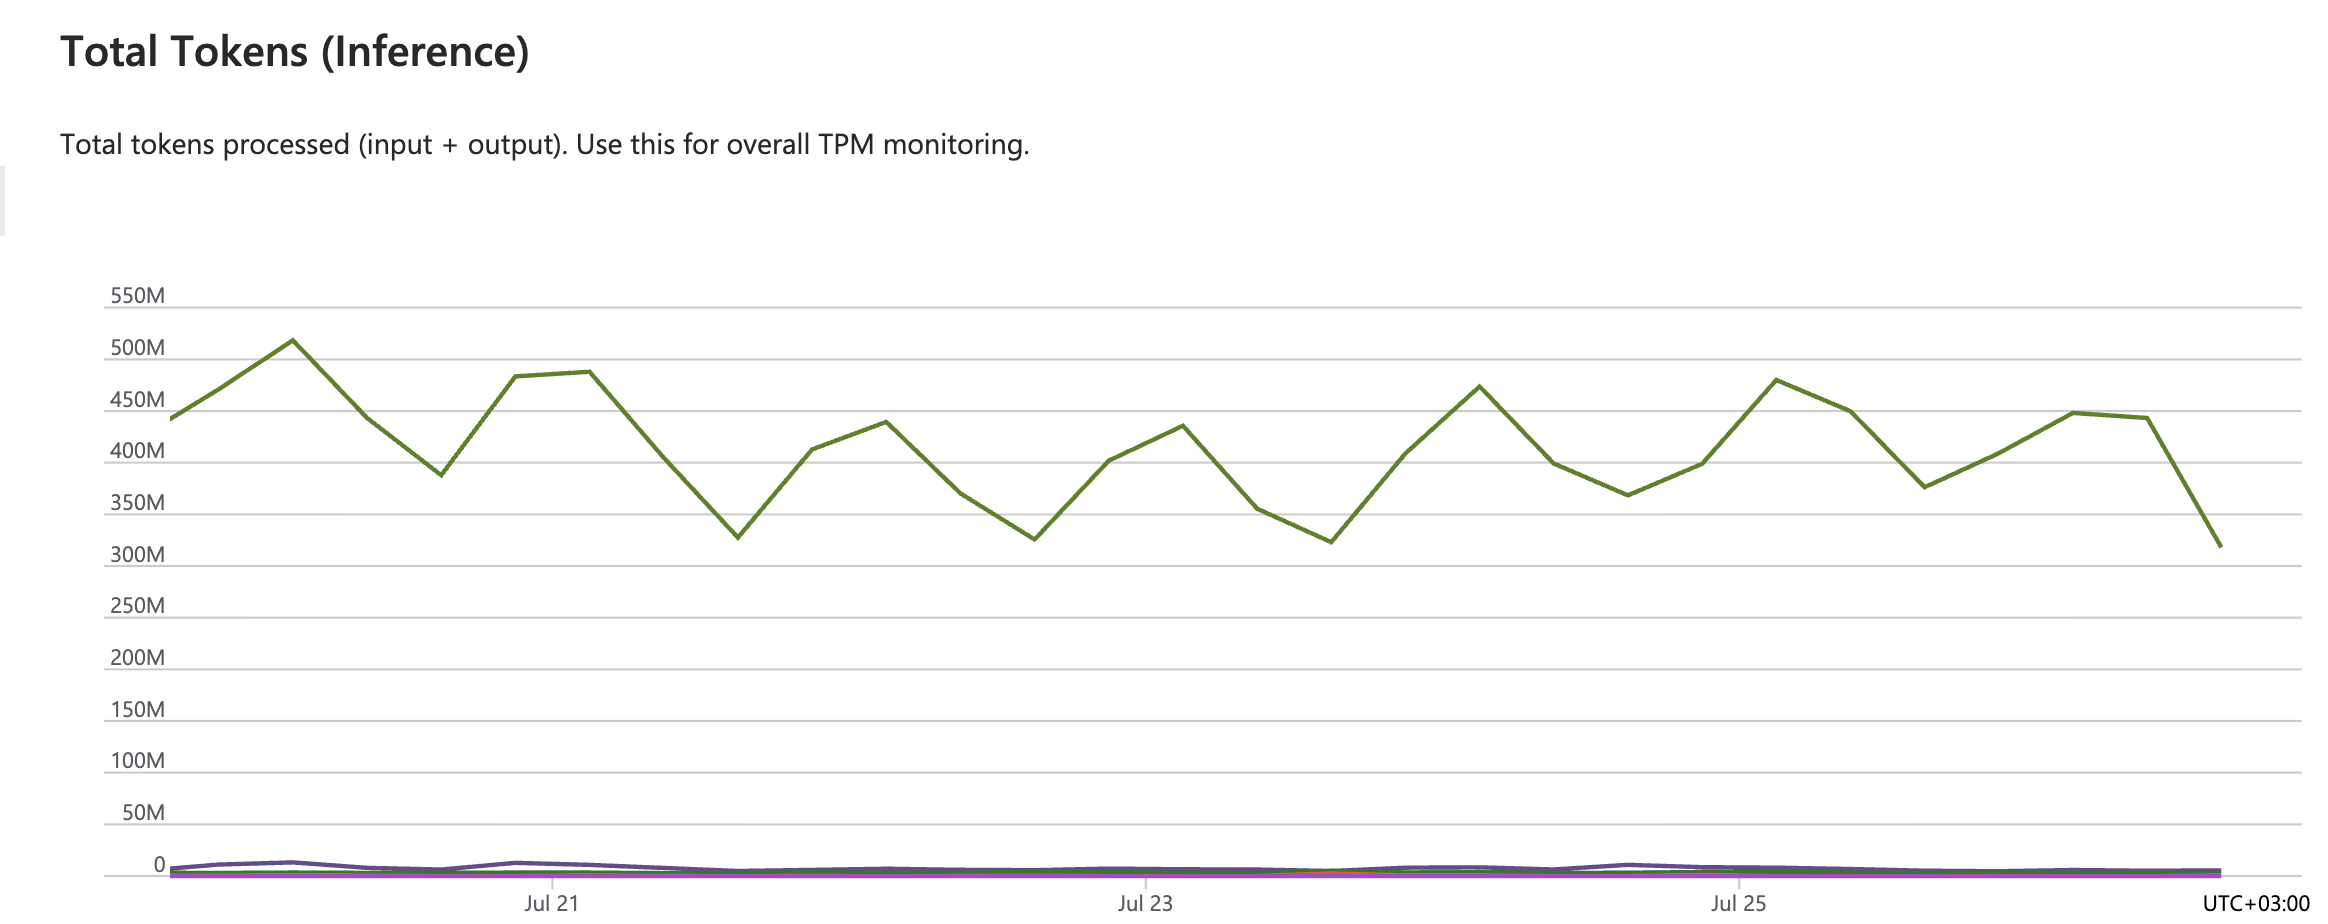
Total tokens Overview
Left unmonitored, TPM/RPM limits surface as throttling incidents rather than a graceful degradation - which is itself an observability failure: the first sign of a capacity problem shouldn't be a rate-limit error in production. PTU vs. Pay-As-You-Go becomes an observability-informed decision rather than a guess: PTU pays off once usage is stable and predictable enough that reserved capacity beats variable per-token billing - a call you can only make correctly if you're already watching TPM/RPM trends over time.
6 · APIM as a Governance & Observability Layer
A GenAI API gateway - Azure API Management (APIM) in front of your AI services - turns several invisible failure modes into observable, governed ones: opaque token consumption becomes token tracking and chargeback, uncontrolled usage becomes cost and capacity management, and inconsistent performance becomes full observability with model- and token-aware routing.
Three APIM policies do most of the heavy lifting:
Token Metric policy - collects token usage data per user or subscription and emits it to Application Insights, enabling accurate cross-charging:
<llm-emit-token-metric namespace="AzureOpenAI">
    <dimension name="User ID" />
    <dimension name="Subscription ID" />
</azure-openai-emit-token-metric>
Semantic Caching policy - caches semantically similar prompts via Azure Cache for Redis, cutting repeated model calls and their token cost:
<azure-openai-semantic-cache-lookup
  score-threshold="0.05"
  embeddings-backend-id="azure-openai-backend">
  <vary-by>@(context.Subscription.Id)</vary-by>
</azure-openai-semantic-cache-lookup>
Token Limit policy - enforces TPM limits per counter key (e.g. per subscription), so throttling happens by policy, not by surprise:
<llm-token-limit
    counter-key="@(context.Subscription.Id)"
    tokens-per-minute="1000"
    estimate-prompt-tokens="false" />
Together, these policies make an AI gateway one of the highest-leverage observability investments you can make: every request that passes through it is automatically metered, capped, and attributable - before it ever reaches your tracing and evaluation layer.

📘 Official Microsoft documentation: Azure API Management GenAI Gateway capabilities
7 · Open Source Reference: TeraSky's AI Foundry FinOps Framework
Everything above is exactly what TeraSky's open-source AI Foundry FinOps Framework implements end to end - APIM token rate limiting, cost quotas, auto-suspend/reactivate, and a live pricing sync, wired into a single Azure Monitor workbook.
API Management
Azure AI Foundry
Log Analytics
Azure Monitor Alerts
Logic Apps
Azure Functions
Architecture: TeraSky-OSS / microsoft-foundry-cost-demo (open source, MIT-style repo).
The framework wires together six pieces:
- API Management - gateway for all AI inference, enforcing rate limits per product tier (Enterprise / Business / Starter).
- AI Foundry - hosts the model deployments (GPT-4.1, GPT-4.1 Mini, DeepSeek V3.2 in the reference setup).
- Log Analytics - stores token usage, pricing data, and subscription quotas.
- Azure Monitor Alerts - KQL queries comparing cost vs. quota every 5 minutes.
- Logic App - receives the alert and calls the APIM API to suspend or reactivate a subscription automatically.
- Azure Function - a daily scheduled sync of live pricing from the Azure Retail Pricing API, so cost math never goes stale.
The cost-calculation flow itself runs as a KQL join every 5 minutes: APIM logs token usage (prompt/completion tokens, subscription ID) to Log Analytics → an alert rule joins that with the pricing table to compute real cost → if cost exceeds quota, the Logic App suspends the subscription → a second alert re-activates it once cost falls back in range (e.g. a new billing period).
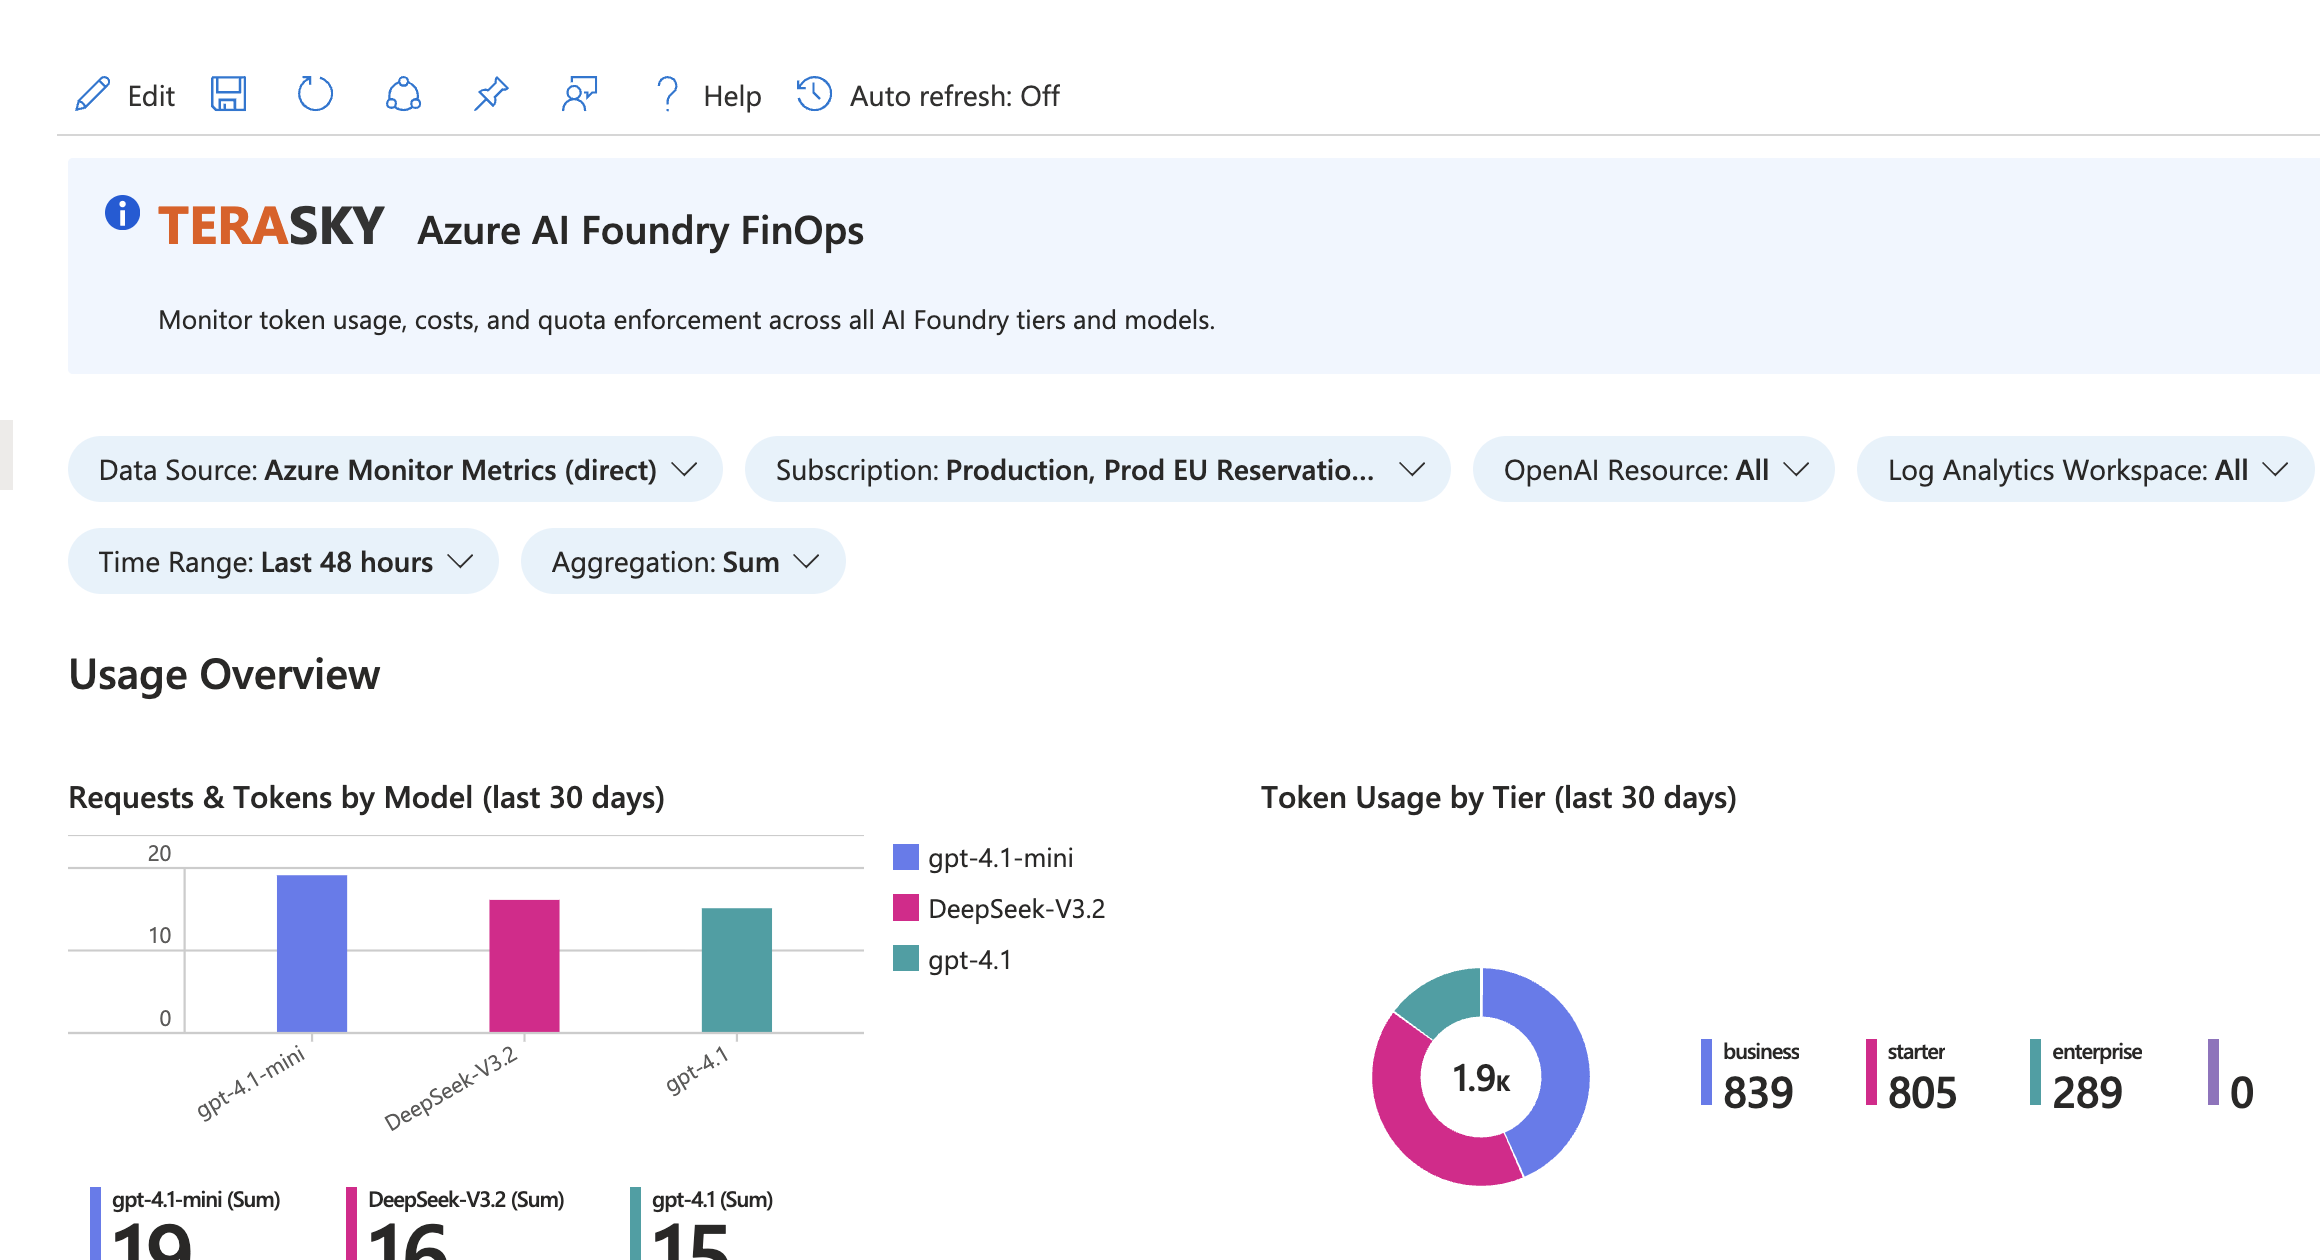
The Microsoft Foundry FinOps workbook
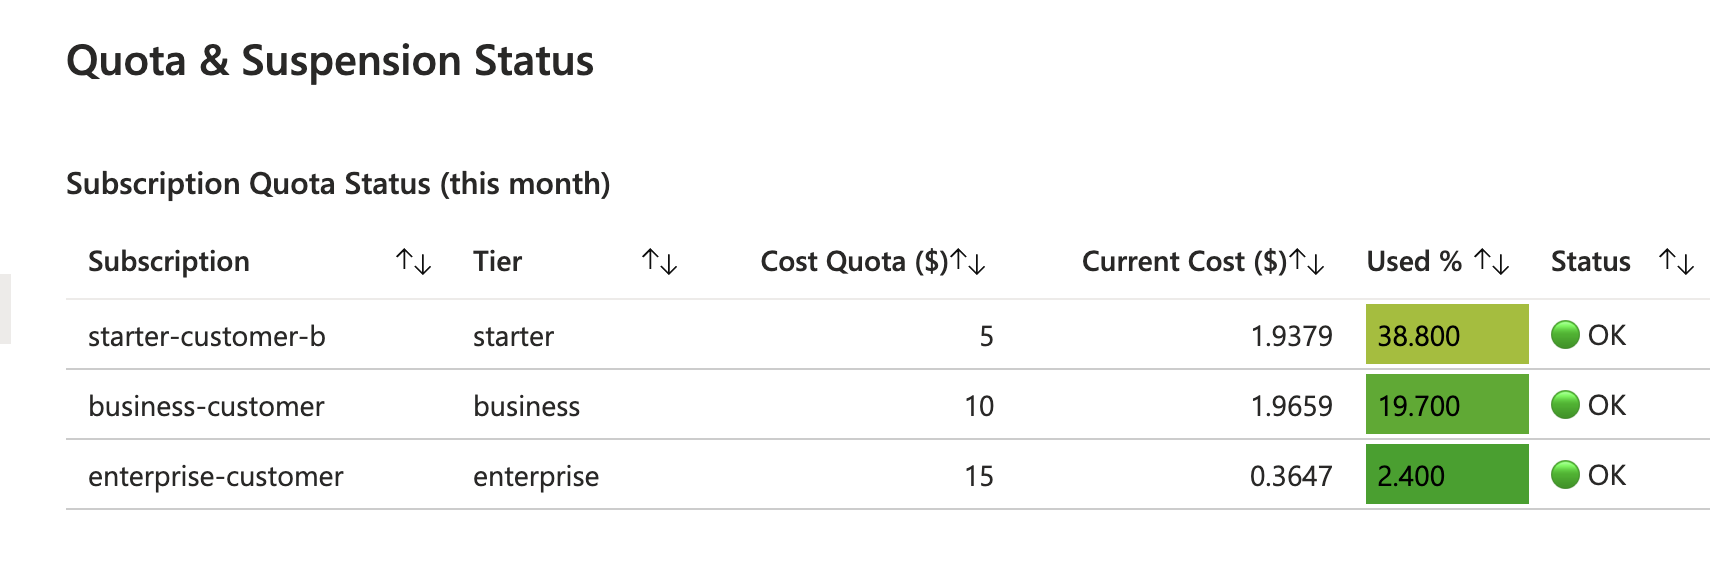
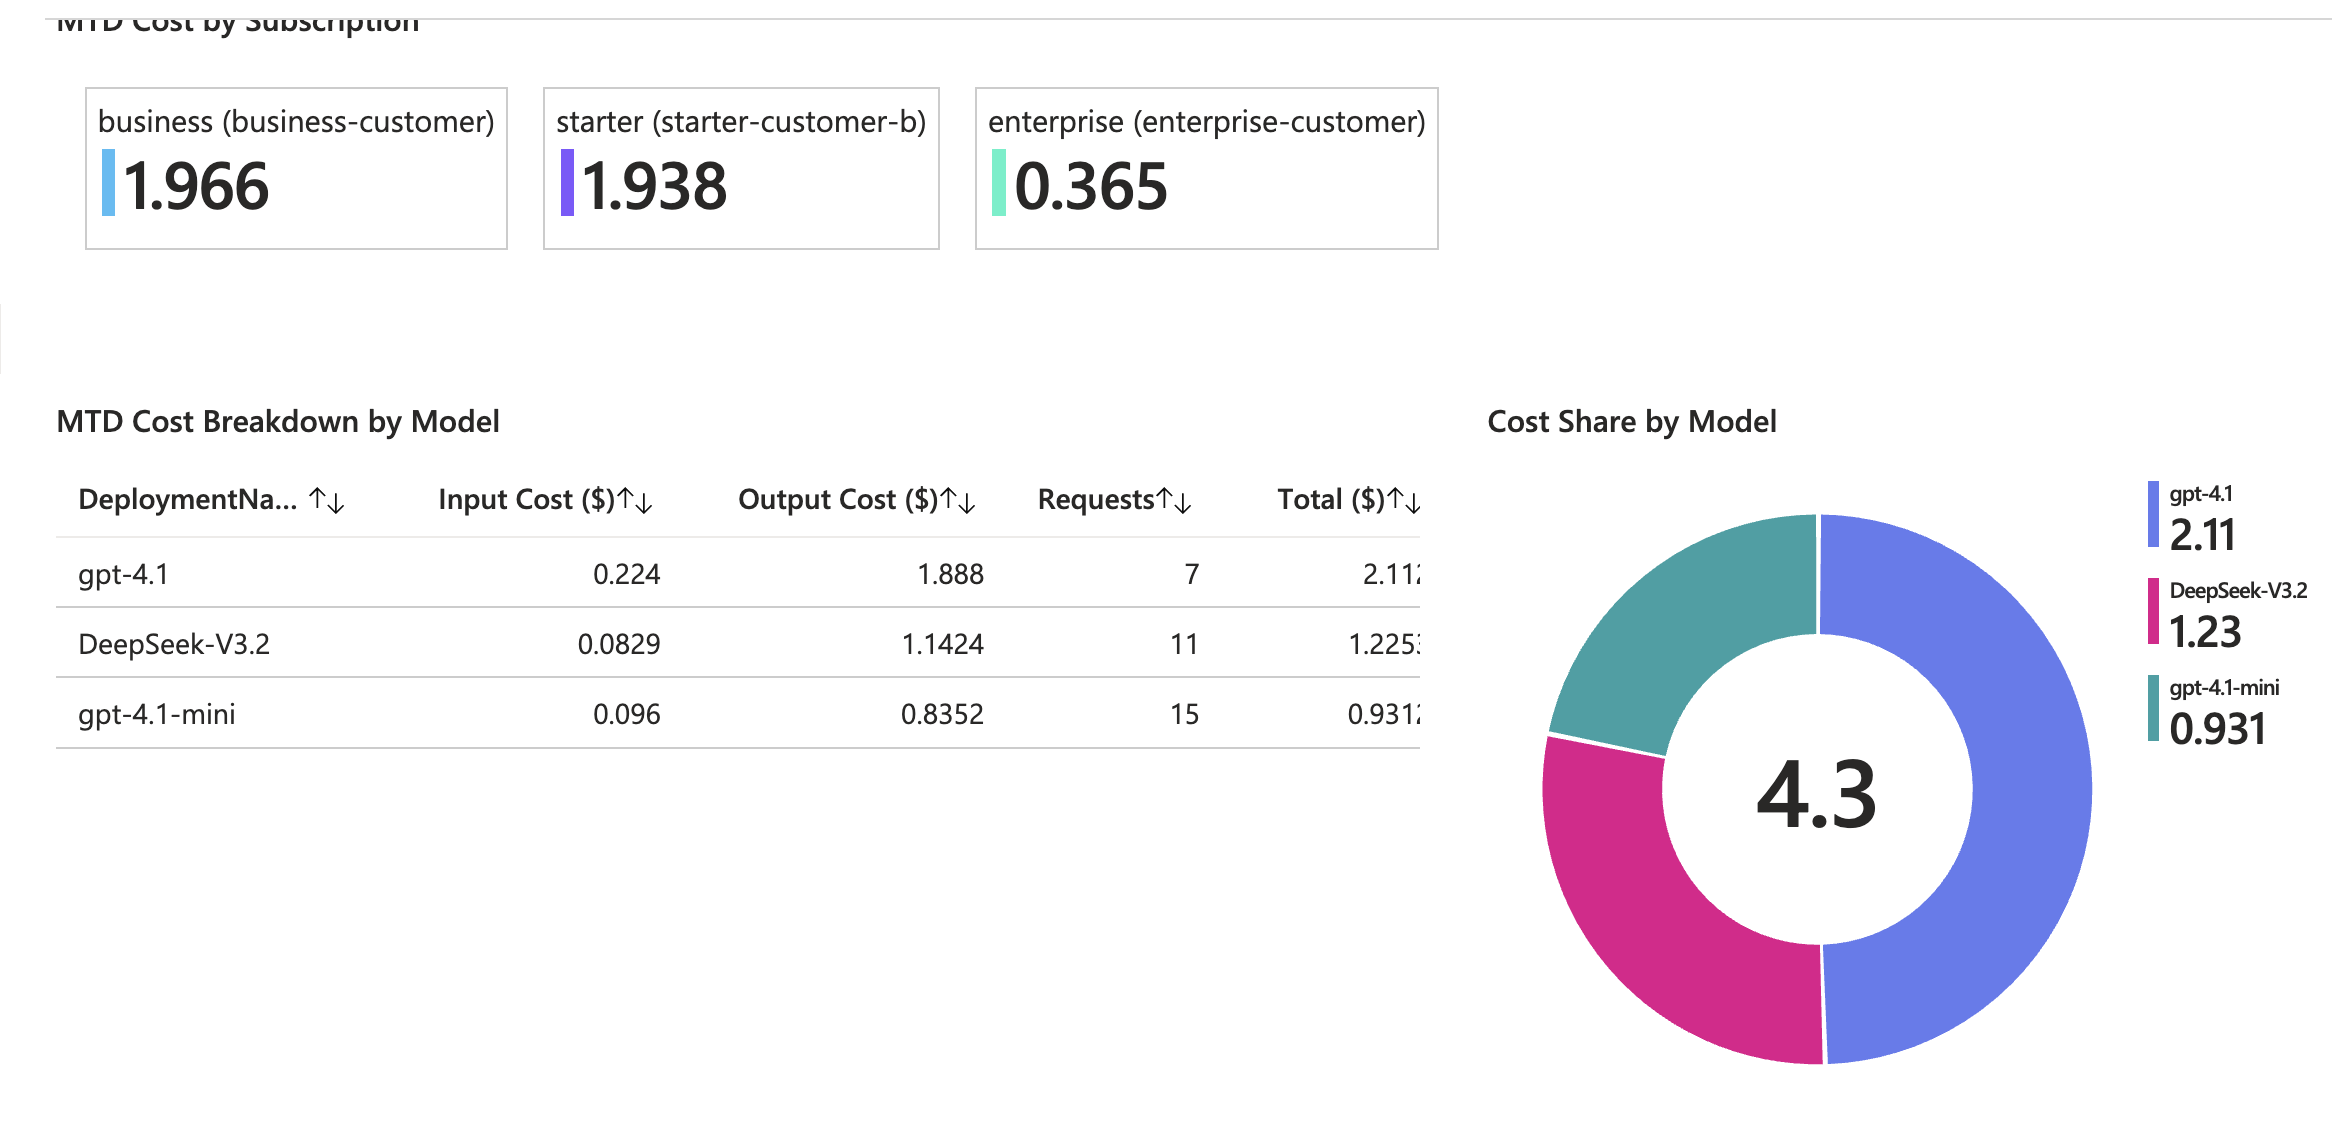
All of this surfaces in one Azure Monitor workbook with four sections: Usage Overview (requests and tokens by model, token usage by tier, request volume over time), Quota & Suspension Status, Cost Analysis (cost over time, MTD cost by subscription and model), and Projected Month-End Cost with a Budget Burn Rate view comparing actual spend pace against expected pace per tier.
Architecture: TeraSky-OSS / microsoft-foundry-cost-demo (open source, MIT-style repo).
Deploying it is a four-step process:
# 1. Infrastructure
az group create --name rg-foundry-finops-demo --location eastus2
az deployment group create --name finops-demo   --resource-group rg-foundry-finops-demo   --template-file main.bicep --parameters parameters.json

# 2. Pricing sync function
cd functions/pricing-sync
func azure functionapp publish <function-app-name> --python

# 3. Seed pricing + quota data
python trigger-pricing-sync.py -g rg-foundry-finops-demo
python ingest-quota.py -g rg-foundry-finops-demo -n finops-demo

# 4. Simulate traffic to populate the dashboard
python simulate.py dashboard -g rg-foundry-finops-demo -n finops-demo --runs 30📗 Repository: github.com/TeraSky-OSS/microsoft-foundry-cost-demo
8 · The Operating Loop
Put together, mature AI observability isn't a dashboard you check - it's a loop:
Trace → Evaluate → Find the weak spot → Improve → Trace again.
Every production incident becomes training data for the next iteration, and every quality regression gets caught by a signal before a customer notices it.
9 · Takeaways
If your AI monitoring strategy only answers "is it up," you have half an observability practice. The other half - is it right, is it grounded, is it costing what it should - requires tracing across infra/data/model layers, continuous quality evaluation, and consumption metering at the gateway, not just uptime checks.
The teams that get ahead of this aren't the ones with the most dashboards. They're the ones who can look at a single trace and immediately tell you which layer broke, why, and what it cost - and who have automated the response, the way TeraSky's FinOps framework auto-suspends a runaway subscription before it becomes a budget incident.
📗 Read more from Captain Azure:
FinOps in Azure - A Practical Guide